|
.png)
|
The graph column allows the user to display a graph in which multiple data series can be displayed. Currently, two types of data series are available:
•Line series - A series of points connected by a line. Gaps may be created by adding points with a null value.
•Point series - A series of individual points presented by markers.
The graph column editor provides options to define the column appearance, as well as access to the series data.
.png)
|
.png)
|
Column properties
|
|
Similar to all other column types. Although the wellbore trajectory may be specified, it has no function in this column type.
|
|
.png)
|
Grid lines
|
|
Define the appearance of vertical and horizontal grid lines (if visible). A value of 1 will show perfectly on the screen but when printed on high resolution printers, lines with a thickness of 1 or 2 may not appear (i.e. they are too fine to be visible). For a typical printer, a thickness of 5 for the major grid lines and 3 for the minor grid lines will give the desired result but some experimentation may be required.
|
|
.png)
|
Vertical axis
|
|
Define the scale and grid line visibility for the vertical (measured depth) axis. To display vertical axis labels, simply add an Axis Column to the left or right of this column.
|
|
.png)
|
Horizontal axis
|
|
Define various settings for a non-visible horizontal axis that is used to show/hide and draw the vertical grid lines. This means that the range (min/max), major tick increment and minor tick count are merely used to draw the grid lines and have no direct relation to the graph series (that display their own axes). For example, the setting may apply a range from 0 to 100 with a major tick increment of 50 and a minor tick count of 4 to display this grid:
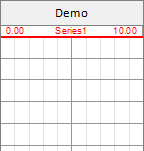
This would mean that each minor grid line represents a multiple of 10 and the major grid lines multiples of 50. however, when adding a series with range from 0 to 10 changes these values to 1 and 5.
Logarithmic will set the horizontal axis to a logarithmic scale. If any of the (pre-existing) series have a invalid min/max values (i.e. less than 0), an error will be raised.
Box behind axes determines the opacity of the area of horizontal axes at the top of the graph.
|
|
.png)
|
Graph series
|
|
Define various settings for each graph series that should be self-explanatory. As for the graph's grid lines, a higher value for Thickness may be required when printing to a high-resolution printer.
As of version 1.2 it is possible to hide the horizontal scale axis (top of graph column) for individual series.
|
|
.png)
|
Add
|
|
Add a new graph series. A dialog will appear to select Line or Point series.
|
|
|
.png)
|
|
.png)
|
Edit...
|
|
Opens the Series Editor dialog that allows input (or import) of the series data.
|
|
|
.png)
|
|
.png)
|
Labels...
|
|
Opens the Label Properties dialog for setting the appearance of the series data labels.
|
|
|
.png)
|
|
.png)
|
Delete
|
|
Permanently delete the currently selected series and all associated data and labels.
|
|
|
.png)
|
|
.png)
|
Re-order
|
|
Move the currently selected series up or down in the series order. Also re-arranges the horizontal axes at the top of the graph column.
|
|
|
.png)
|
|
Copyright © 2025 Softdrill NL