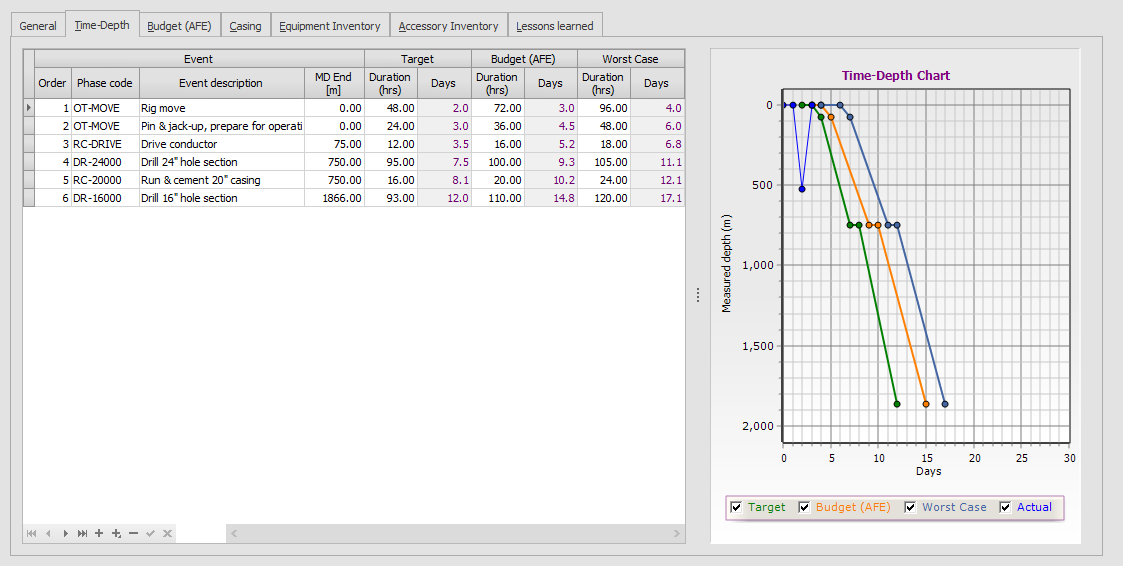
The time-depth chart is a graph of days versus measured depth for the well. The [Order] column can be used to sort the various phases of the well, where the Phase code column defines the type of phase (i.e. DR-16000 for drilling 16” hole). For each phase an ending MD must be entered, as well as at least one value in one of the three duration columns ([Target], [Budget] or [Worst Case]).
Typically Budget (AFE) is used as the standard time-depth curve, but Target and Worst case curves may also be created and plotted.
When an AFE is produced by means of probabilistic analysis (Monte Carlo simulation) the Target curve is typically the P50 duration, the Budget (AFE) curve the P70 duration and the Worst Case curve the P90 duration. Alternatively the Target and Worst Case curve may be entered as a percentage below/above the target curve.
After entering data (note that durations must be entered in hours), calculate the form to update the phase days and time-depth graph. The Actual curve is drawn automatically from the Daily Report data.
The check-boxes in the legend of graph shown may be used to show or hide specific series on the chart.
To print the time-depth chart, select 'Time-depth curve' in the report type drop-down and click the printer button. In the print dialog visibility and colors for each series may be customized to preference.
From the chart context menu (right-click chart to access), the chart may be copied to the Windows clipboard. From the clipboard, the chart can be pasted into other applications, such as Microsoft Word, Powerpoint, etc.
|
Copyright © 2023 Softdrill NL |