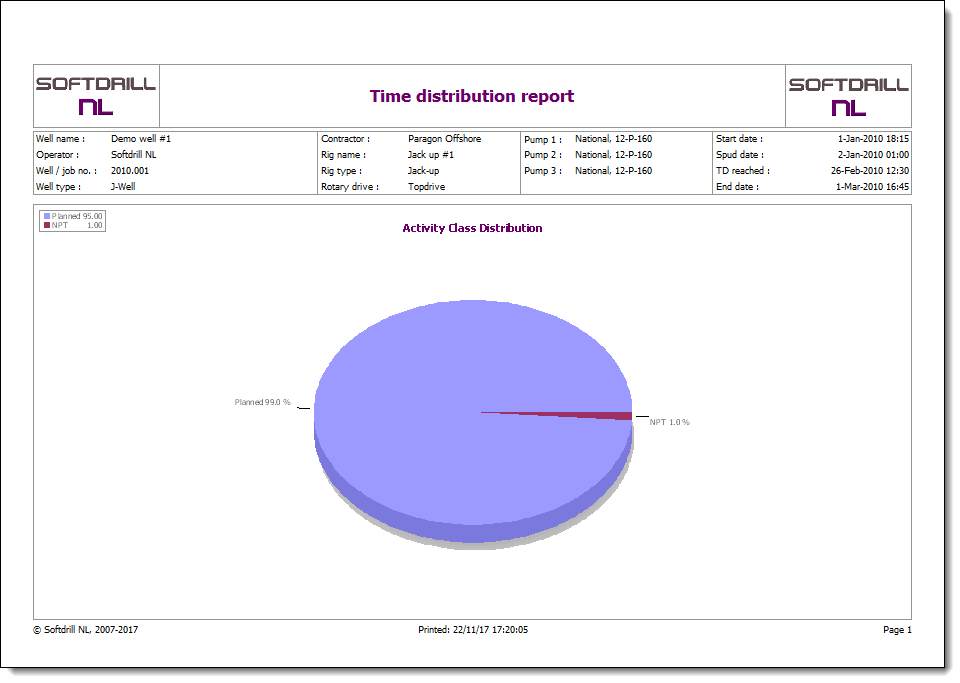
Two pie charts are printed on the Time Distribution Report (each on their own page);
1.Event (activity) classes as a percentage of the total time spent on the well.
2.Root Causes as a percentage of the total NPT/SI time for the well.

|
Copyright © 2023 Softdrill NL |